In the grand story of life, few things matter as much as our health. It is the key to a good life—being well, having access to doctors, and the power to follow our dreams. The health of a whole nation is like a mirror reflecting its happiness, struggles, and future hopes. But when we look at Africa, we see a different story unfolding. It’s a story about health system gaps, health needs, and the choices we make.
Health is more than just not being sick. It means living a good life, getting the care you need, and having the strength to grow. It’s the building block of society, the secret to making our dreams come true, and the way we measure a country’s strength.
Health systems are like the guardians of this treasure. They’re the networks of hospitals, doctors, and clinics that keep us healthy, and they’re how we spend the money we have for health.
Today, the health of Africa is more important than ever. Africa is a place of rich cultures and many challenges. It has over 50 countries, each with its own story, resources, and health problems. Here, health systems are part of everyday life, and they make a huge difference.
World Health Organization’s World Countries Ranking for Health Systems Performance
In the year 2000, the World Health Organization (WHO) ranked all the health systems in the world. This was the last time they did it. Those rankings let us look into the past and see how health in Africa has changed. Each ranking tells a story.
I scraped this data from the Wikipedia page and analysed it (link to my Python codes) to draw insights. Let’s break down what each column means:
Country: This column simply tells us the names of the different African countries. It’s like a list of all the places we’re looking at.
Attainment of Goals / Health / Level (DALE): DALE stands for “Disability-Adjusted Life Expectancy.” It’s a way to measure how long people can live in good health. So, this column tells us how healthy people can be in each country.
Attainment of Goals / Health / Distribution: This column talks about how health is shared in a country. It’s about fairness. Do some people get good health, while others don’t? This column gives us a clue.
Attainment of Goals / Health / Overall Goal Attainment: This is like a big summary. It looks at everything—how long people live in good health, how health is shared, and more. It’s a bit like giving a grade for the whole health system.
Health expenditure per capita in international dollars: This one is about money. It tells us how much a country spends on health care for each person. It’s a way to see if a country is spending a lot or a little on health.
Performance / On the level of health: This is about how good the healthcare is at keeping people healthy. It’s like asking, “Is the healthcare helping people to stay well?”
Performance / Overall health system performance: This is like a final score. It’s all about how well the whole health system works. Where each country ranks compared to other countries.
So, we’ve got a list of countries and lots of information about how healthy people are, how fair health is, how much money is spent on health, and how well the health system works. By looking at this data, we can learn about what’s going well and where there’s room for change. It’s like finding clues to help countries make their health systems even better.
What the Data for the Countries in the World Tell Us
1. Attainment of Goals / Health / Level (DALE):
Top 5 Countries: Japan, Australia, France, Sweden, Spain
Least 5 Countries: Botswana, Zambia, Malawi, Niger, Sierra Leone
When we look at how long people can live in good health, Japan comes out on top, with Australia, France, Sweden, and Spain following closely. On the other hand, countries like Botswana, Zambia, Malawi, Niger, and Sierra Leone face greater health challenges and have lower DALE scores. This suggests that these nations may need to focus on improving the overall health and well-being of their populations.
2. Overall Health System Performance:
Top 5 Countries: France, Italy, San Marino, Andorra, Malta
Least 5 Countries: Nigeria, Democratic Republic of the Congo, Central African Republic, Myanmar, Sierra Leone
When we consider how well the entire health system is performing, countries like France, Italy, San Marino, Andorra, and Malta shine as top performers. They likely have effective healthcare systems that deliver good results. On the flip side, countries such as Nigeria, the Democratic Republic of the Congo, the Central African Republic, Myanmar, and Sierra Leone face significant healthcare challenges and might need to focus on improving their overall health systems.
3. Attainment of Goals / Health / Distribution:
Top 5 Countries: Chile, United Kingdom, Japan, Norway, Poland
Least 5 Countries: Malawi, Nigeria, Central Republic of Congo, Mozambique, Liberia
When it comes to how health is distributed within a country, Chile, the United Kingdom, Japan, Norway, and Poland do a good job of making sure health is shared fairly among their populations. On the other hand, Malawi, Nigeria, the Central Republic of Congo, Mozambique, and Liberia face challenges in ensuring that health resources are distributed equitably. This points to the importance of promoting fair access to healthcare within these nations.
4. Health Expenditure per Capita in International Dollars:
Top 5 Countries: United States, Switzerland, Germany, France, Luxembourg
Least 5 Countries: Eritrea, Democratic Republic of the Congo, Ethiopia, Madagascar, Somalia
The amount of money a country spends on healthcare can have a big impact on the quality of its health system. The United States, Switzerland, Germany, France, and Luxembourg are the top spenders on health per person, indicating a commitment to investing in healthcare. On the other hand, countries like Eritrea, the Democratic Republic of the Congo, Ethiopia, Madagascar, and Somalia spend less on healthcare per person, which can pose challenges in providing quality healthcare services to their populations.
These insights help us understand the diverse health scenarios in different countries. They provide a starting point for policymakers and healthcare professionals to identify areas for improvement and work towards better healthcare outcomes for their citizens.
Correlation with Health Expenditure Per Capita
This explores the relationship between health expenditure and different metrics for health system performance for countries that ranked top 20 in the world for overall best health system.
Health Expenditure vs. Attainment of Goals / Health / Level (DALE):

There is a strong positive correlation (0.76) between a country’s health expenditure and the level of health (DALE). This means that as a country spends more on healthcare per person, the overall health level tends to improve significantly. The low p-value indicates that this relationship is statistically significant, suggesting that this correlation is not just by chance.
Health Expenditure vs. Attainment of Goals / Health / Distribution
There is a positive correlation (0.65) between health expenditure and the fair distribution of health resources within a country. This suggests that as a country spends more on healthcare per person, there is an inclination towards fairer health resource distribution. The p-value indicates that this correlation is statistically significant.
Health Expenditure vs. Attainment of Goals / Health / Overall Goal Attainment:
There is a very strong positive correlation (0.90) between health expenditure and the overall attainment of health goals. This means that higher health expenditure is closely related to achieving broader health objectives. The very low p-value underscores the statistical significance of this relationship.
Health Expenditure vs. Performance / On the Level of Health:
Health Expenditure vs. Performance / Overall Health System Performance:
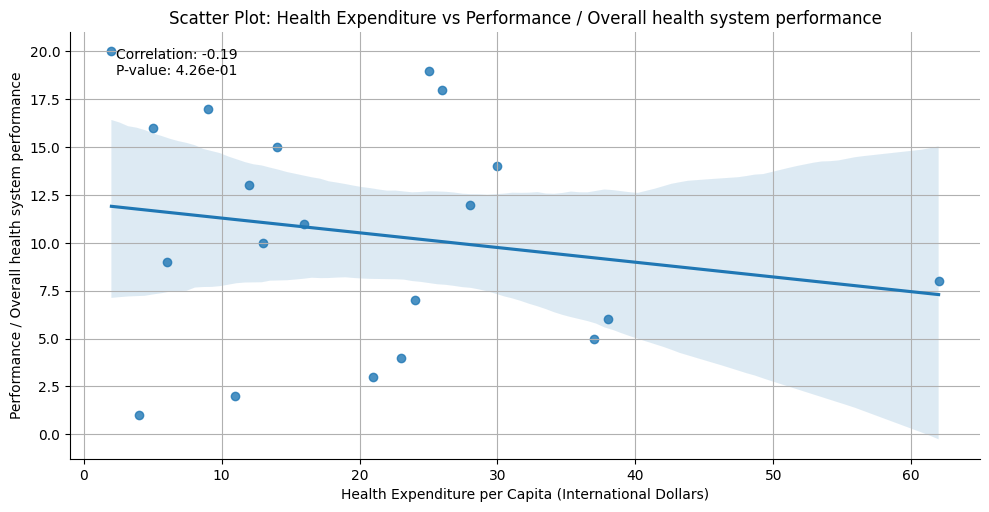
There is a weak negative correlation (-0.19) between health expenditure and the overall performance of the health system. This implies that increased spending on healthcare does not always result in better overall health system performance. The high p-value suggests that this correlation is not statistically significant.
Correlation Between Health Distribution and Health Metrics
This unveils the connections between how resources are distributed within a nation’s healthcare system and the resulting health outcomes.
Attainment of Goals / Health / Distribution vs. Attainment of Goals / Health / Level (DALE):
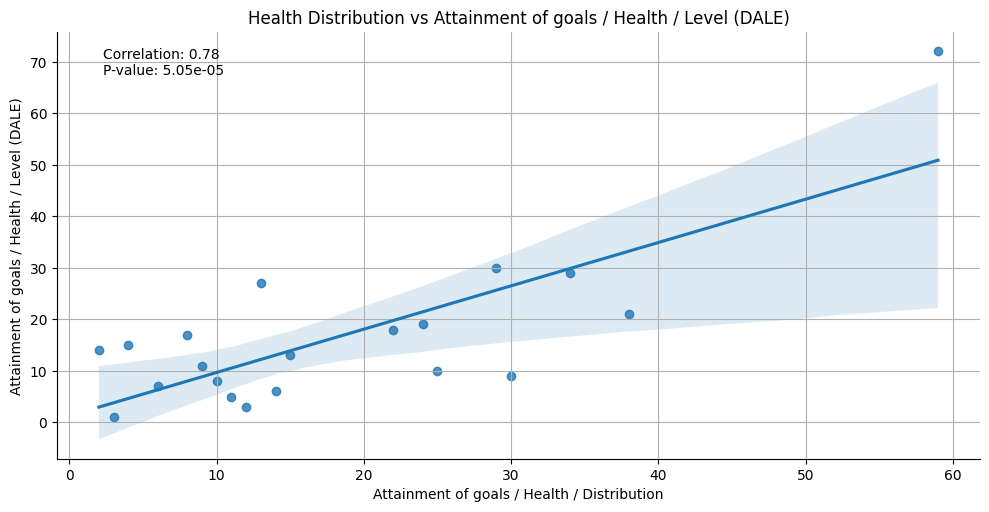
There is a strong positive correlation (0.78) between the fair distribution of health resources and the overall level of health (DALE). This suggests that when a country ensures fair distribution, it often leads to improved overall health. The low p-value indicates that this relationship is statistically significant.
Attainment of Goals / Health / Distribution vs. Attainment of Goals / Health / Overall Goal Attainment:
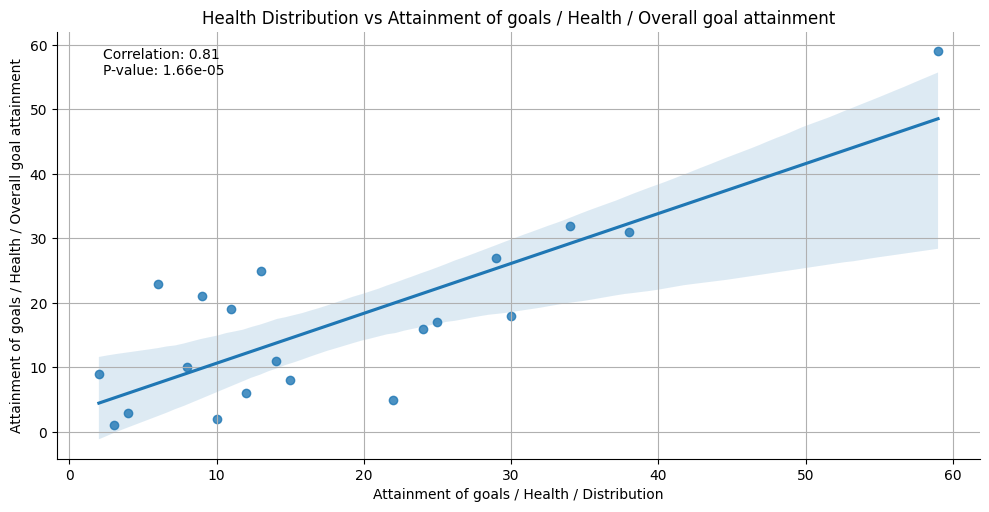
The strong positive correlation (0.81) implies that when resources are distributed fairly, countries are more likely to achieve their broader health objectives.
Attainment of Goals / Health / Distribution vs. Performance / On Level of Health:
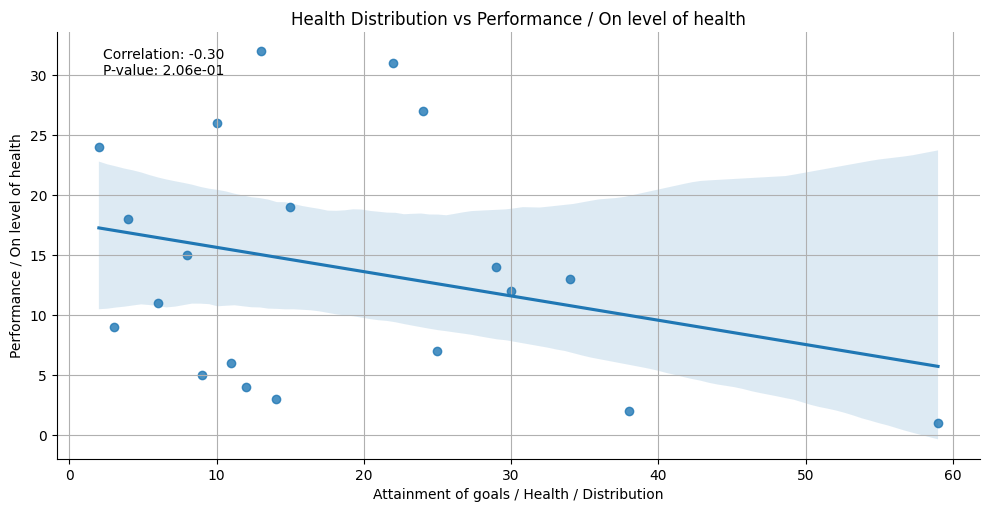
The moderate negative correlation (-0.3) suggests that while fair distribution is important, it may not always lead to better performance in maintaining health. The p-value indicates that this correlation may not be statistically significant.
Attainment of Goals / Health / Distribution vs. Performance / Overall Health System Performance:
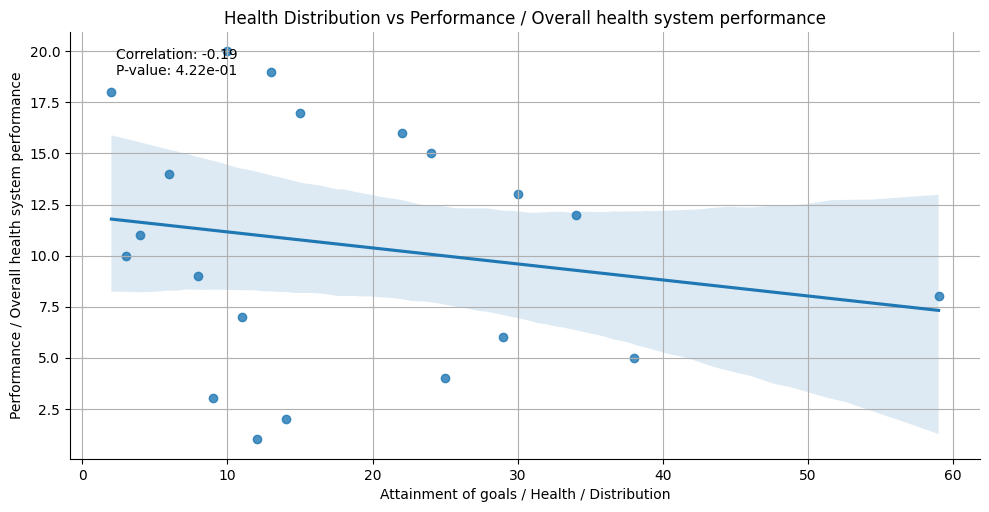
The weak negative correlation (-0.19) suggests that fair distribution does not always equate to better overall health system performance. There are other factors that contribute to overall health system performance The high p-value indicates that this correlation is not statistically significant.
These insights provide a valuable understanding of the relationships between health expenditure, health distribution, and different health metrics, helping
policymakers make informed decisions for improving healthcare systems in African countries.
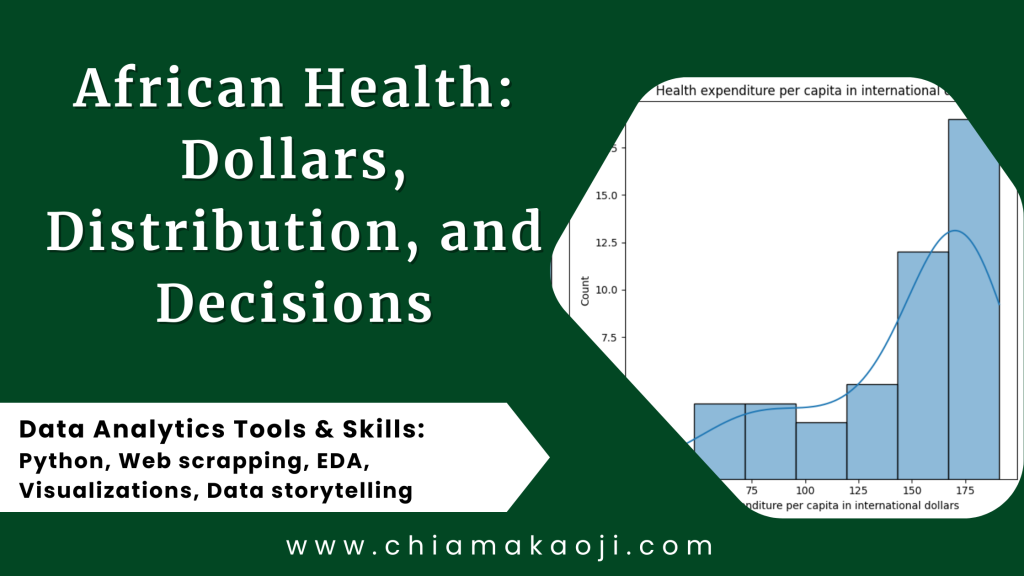
Distribution Charts For Some Metrics in African Countries
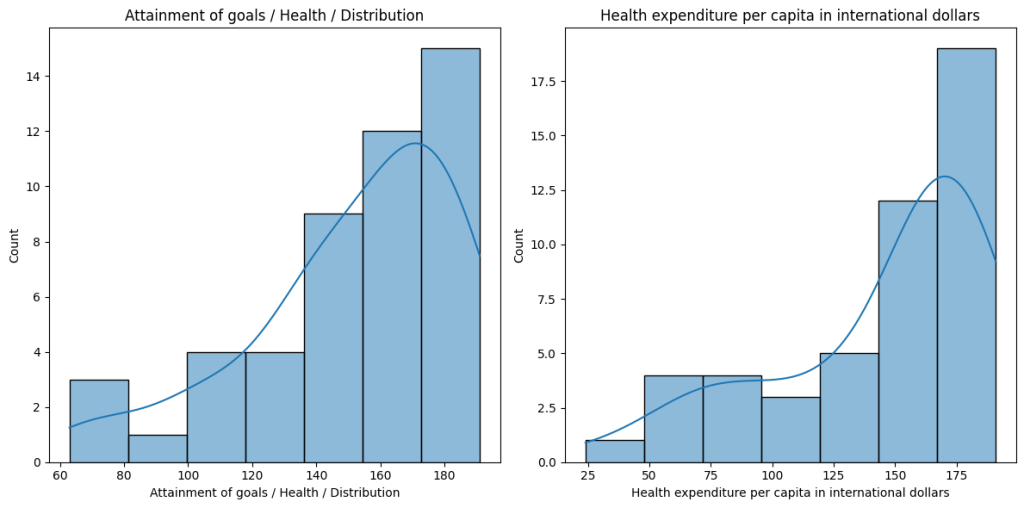
The histogram plots for these metrics – Health distribution and Health Expenditure – are skewed to the left. This suggested that in many African countries, there is a tendency for health resources to be less evenly distributed, with a larger portion of the population potentially facing challenges in accessing healthcare equitably. And in many African countries, the spending on healthcare per person is relatively lower, potentially impacting the quality and accessibility of healthcare services.
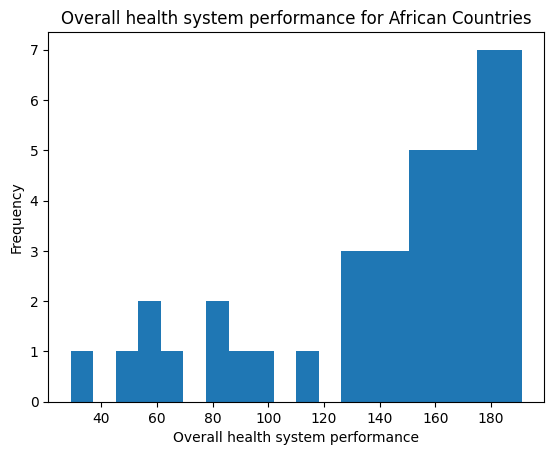
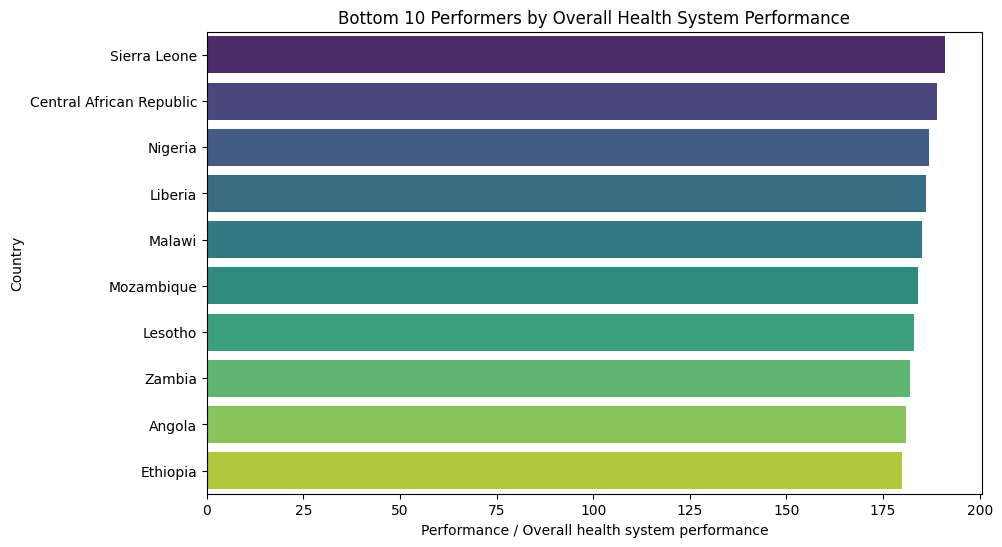
Overall Health System Performers in African Countries
The 5 lowest overall health system performers in African countries are Sierra Leone, Central African Republic, Nigeria, Liberia, and Malawi. These countries face significant challenges in their healthcare systems, and there is a need for substantial improvements to enhance the overall performance of their health systems.
Correlation Between Health Expenditure and Health Metrics for African Countries
Health Expenditure vs. Attainment of Goals / Health / Level (DALE):
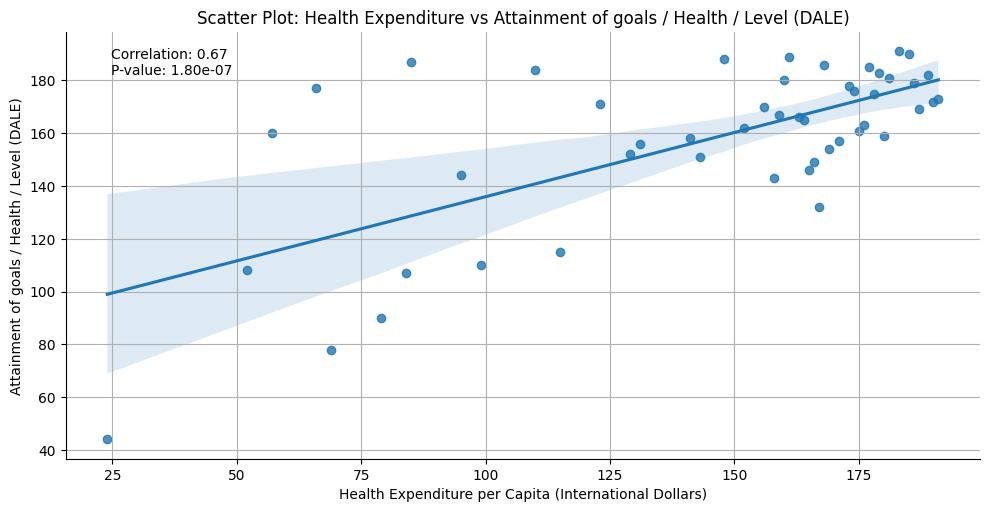
There is a strong positive correlation (0.67) between health expenditure and the level of health (DALE) in African countries. This suggests that higher healthcare spending is associated with better health levels. The low p-value indicates that this relationship is statistically significant.
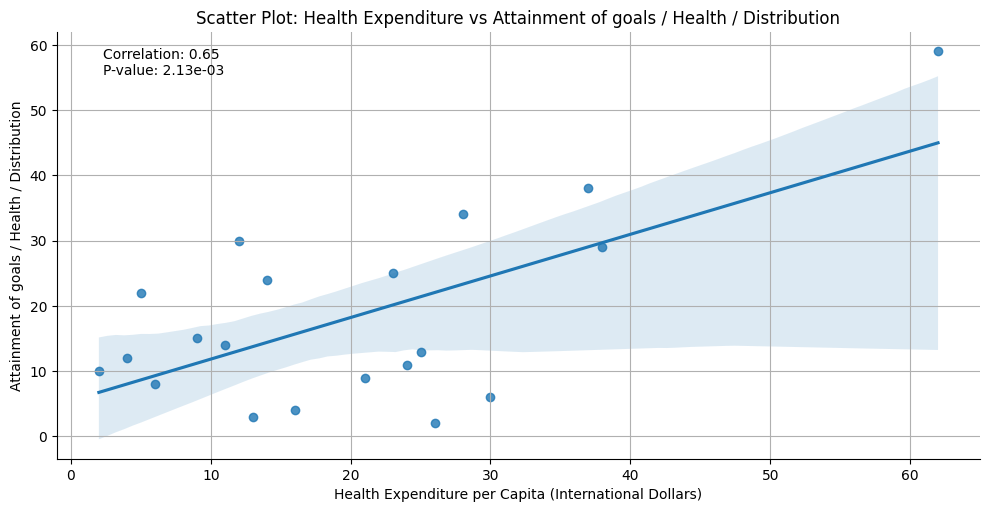
Health Expenditure vs. Attainment of Goals / Health / Distribution:
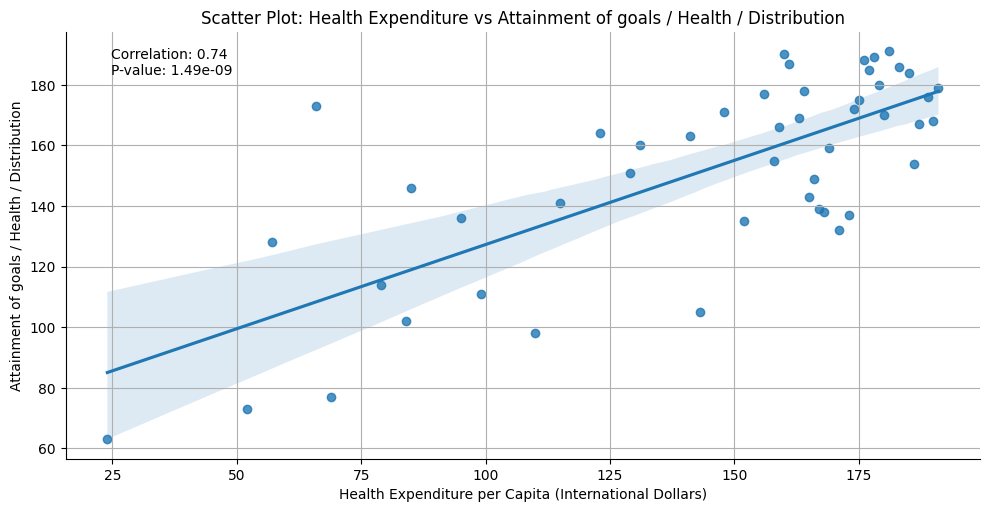
The strong positive correlation (0.74) indicates that increased healthcare spending in Africa is linked to a more equitable health resource distribution.
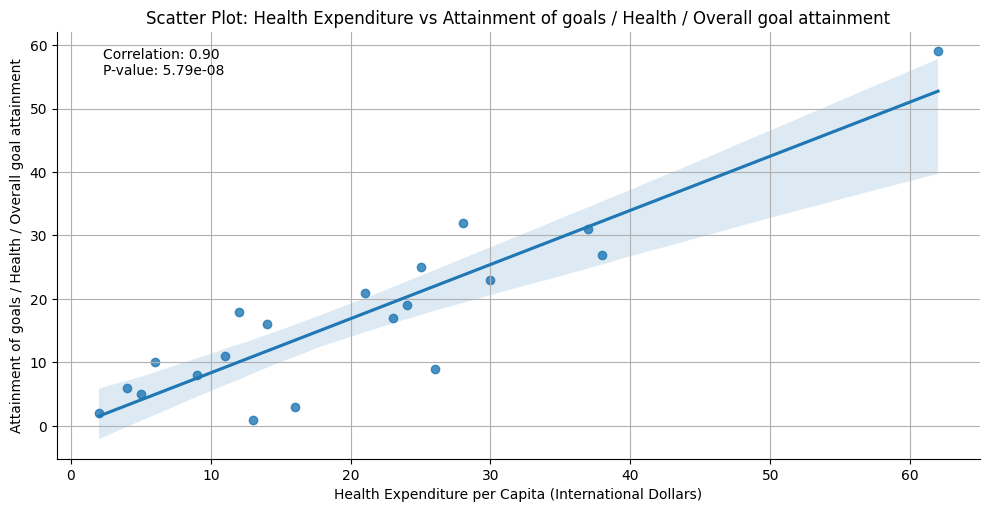
Health Expenditure vs. Attainment of Goals / Health / Overall Goal Attainment:
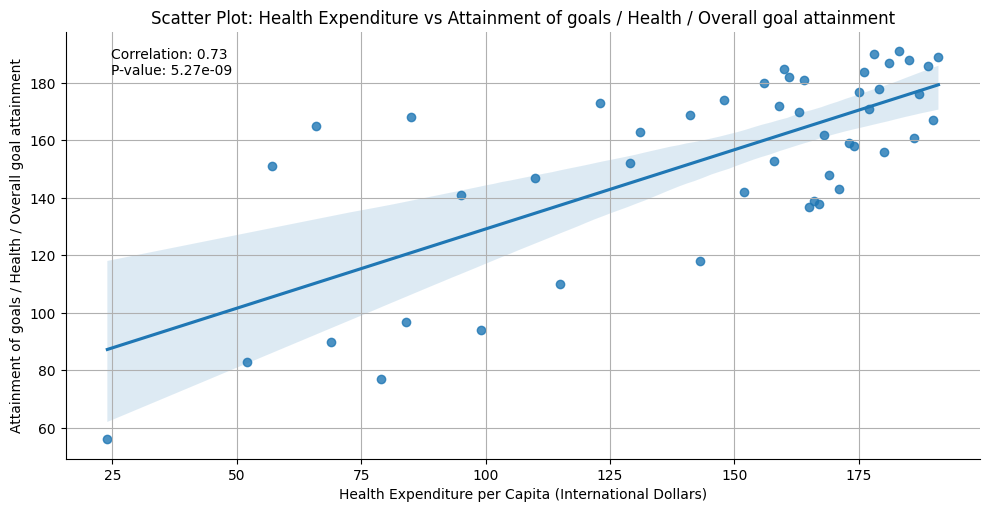
The strong positive correlation (0.73) implies that higher healthcare spending is closely related to achieving broader health objectives
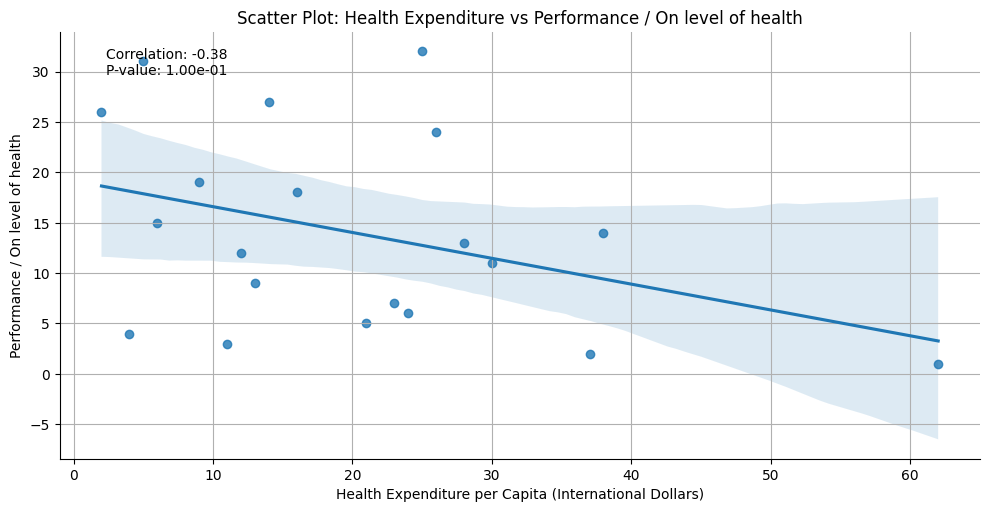
Health Expenditure vs. Performance / On Level of Health:
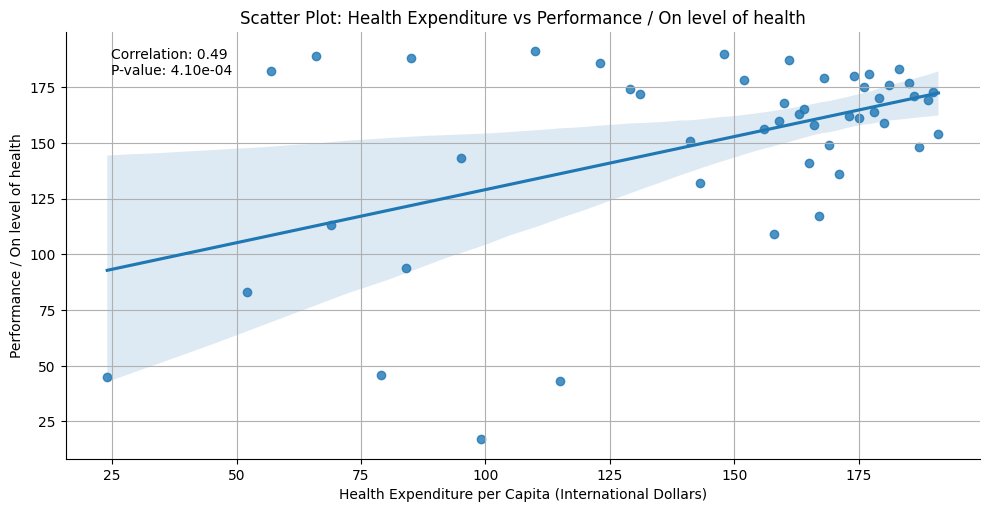
The moderate positive correlation (0.49) suggests that higher spending is associated with a moderate improvement in health performance.
Health Expenditure vs. Performance / Overall Health System Performance:
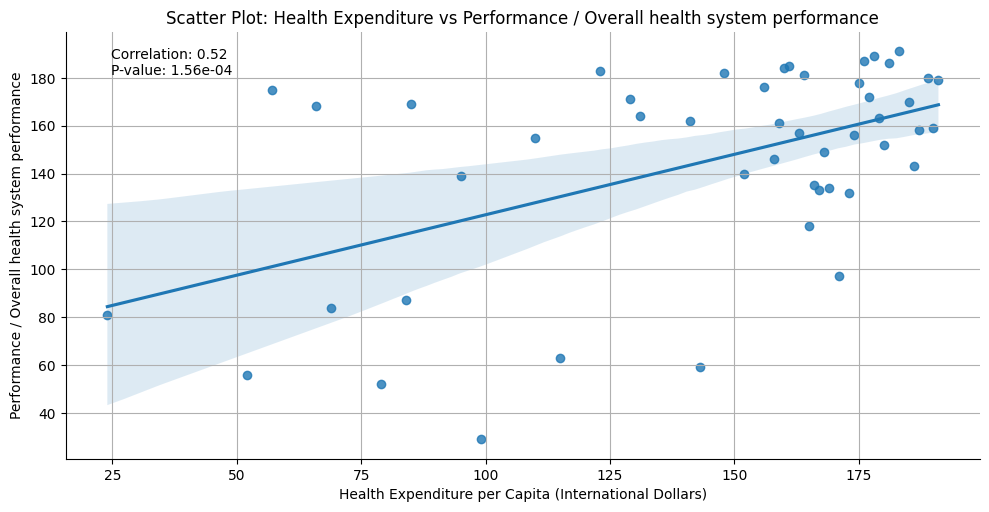
There is a moderate positive correlation (0.52) between health expenditure and the overall performance of the health system in African countries. This means that higher healthcare spending is related to better overall health system performance.
Relationship Between Health Distribution and Health Metrics for African Countries
The 5 least countries with health distribution issues in African countries are Liberia, Mozambique, Central African Republic, Nigeria, and Malawi. These countries face challenges in ensuring fair and equitable distribution of health resources among their populations.
The relationship plots highlight the significant correlations between health expenditure, attainment of health goals, and health system performance in African countries.
In comparison, we can see some similarities in the correlation insights between the world data and the African data, but there are also some differences:
- Both the world data and the African data show a strong positive correlation between health expenditure and the attainment of health goals (DALE).
- In the world data, there is a strong positive correlation between health expenditure and overall goal attainment, while in the African data, the correlation is strong but slightly lower.
- In the world data, there is a moderate negative correlation between health expenditure and the performance on the level of health, while in the African data, the correlation is moderate but positive.
- Both datasets show a moderate positive correlation between health expenditure and overall health system performance.
It’s important to note that the specific values and strengths of correlations may vary between the world and African datasets, but the overall trends suggest that higher health expenditure is generally associated with better health outcomes and health system performance in both contexts.
In comparing the insights related to health distribution, we can observe the following:
Both the world data and the African data show strong positive correlations between the distribution of health resources and the attainment of health goals and overall goal attainment.
In the world data, there is a moderate negative correlation between the distribution of health resources and the performance on the level of health, while in the African data, the correlation is moderate but positive.
Both datasets exhibit a very strong positive correlation between the distribution of health resources and overall health system performance.
These findings suggest that equitable distribution of health resources is associated with better health outcomes and health system performance, both on a global scale and specifically in African countries.
A report by statistica.com revealed the health system rankings for 2023.
The comparison between the 2023 health system rankings and the 2000 WHO data reveals interesting insights about the changes in health systems over time.
Top 5 Ranked Countries in 2023:
Singapore
Japan
South Korea
Taiwan
China
Top 5 Countries in 2000 (from the WHO data):
Japan (Top performer in 2000)
Australia
France
Sweden
Spain
There is a notable difference between the top-performing countries in 2023 and the year 2000. Japan, which was the top performer in 2000, continues to maintain a high ranking in 2023. However, Singapore, South Korea, Taiwan, and China have emerged as strong contenders in the current rankings, indicating significant improvements in their healthcare systems over the years.
Worst 12 Ranked Countries in 2023:
Central African Republic
South Sudan
Chad
Lesotho
Somalia
Sierra Leone
Swaziland
Liberia
Guinea
Angola
Nigeria
Equatorial Guinea
These countries have a relatively low ranking in the 2023 report, signifying ongoing health system challenges. It’s interesting to note that some of these countries, such as Sierra Leone and Nigeria, were also among the least-performing countries in the 2000 WHO data. This suggests that despite efforts to improve healthcare systems over the years, these nations continue to face significant health challenges.
Overall, the comparison highlights the dynamic nature of healthcare systems, with some countries making substantial progress over the years, while others continue to struggle with healthcare infrastructure and delivery.
Recommendations For Africa’s Health System
Based on the insights gained from the analysis of the World Health Organization (WHO) ranking data from 2000, especially with a focus on African countries, here are strong recommendations and resolutions for our data story, “African Health: Dollars, Distribution, Decisions”:
- Investment in Healthcare: African countries should prioritize increasing health expenditure per capita in international dollars. The data consistently shows a positive correlation between health expenditure and health outcomes. Policymakers should allocate more resources to healthcare to improve the overall health system performance.
- Equitable Resource Distribution: Ensuring the equitable distribution of health resources remains a critical focus for African countries. The strong positive correlation between the distribution of health resources and health goal attainment underscores the importance of fair allocation and access to healthcare services.
- Targeted Interventions for Underperforming Countries: African nations with the lowest health system performance, such as Sierra Leone, Central African Republic, and Nigeria, should implement targeted interventions to address their healthcare challenges. Learning from the experiences of countries that have successfully improved their health systems is crucial.
- Regional Collaboration: African countries should consider regional collaboration to share best practices, improve healthcare infrastructure, and address common health challenges collectively. Regional health initiatives and cooperation can lead to more efficient resource allocation.
- Research and Data-Driven Policy: Policymakers should emphasize the importance of data-driven decision-making. Regular collection and analysis of health data can provide insights into the effectiveness of healthcare policies and identify areas that require improvement.
- Health Awareness and Education: Increasing health awareness and education among the population is essential. Encouraging healthier lifestyles and early disease prevention can reduce the burden on healthcare systems.
- International Assistance: Collaborating with international organizations and seeking assistance from the global community can be instrumental in addressing healthcare challenges. Partnerships with organizations that specialize in healthcare development can provide valuable resources and expertise.
- Transparency and Accountability: Ensuring transparency and accountability in healthcare resource allocation and utilization is fundamental. Transparency fosters public trust, and accountability measures can help in preventing the misuse or misallocation of resources.
This data story, “African Health: Dollars, Distribution, Decisions,” serves as a valuable resource for policymakers, researchers, and healthcare professionals. It highlights the importance of data analysis in understanding the strengths and weaknesses of healthcare systems in African countries and can inform critical healthcare policy decisions to improve the overall health and well-being of the population.