Ever wondered what your fitness tracker’s secrets could tell about your daily dance with life?
Well, Bellabeat’s got a story to share, and I’ll be decoding it through this project.
I aim to analyze smart device fitness data for Bellabeat, a company specializing in health-focused products for women. Bellabeat is a successful small company, but its leadership envisions becoming a more prominent player in the global smart device market.
My analysis focuses on Bellabeat’s “Bellabeat Membership,” a subscription-based program offering personalized nutrition, activity, sleep, health, beauty, and mindfulness guidance.
Through this membership, users can access tailored recommendations and insights based on their unique lifestyles and goals.
First Phase: ASK Phase
Business Task
Identifying trends in how consumers use non-Bellabeat smart devices to glean insights for refining Bellabeat’s marketing strategy.
Second Phase: PREPARE Phase
Dataset Used
The case study draws insights from the Fitbit Fitness Tracker Data, accessible via Kaggle and provided through Mobius.
Accessibility and Privacy of Data
The FitBit dataset is open-source, allowing for unrestricted usage. The dataset’s metadata confirms its dedication to the public domain, ensuring flexibility for commercial purposes without seeking permission.
Information About the Dataset
The dataset stems from a survey conducted via Amazon Mechanical Turk between 03.12.2016-05.12.2016. Thirty eligible Fitbit users consented to sharing personal tracker data, encompassing minute-level details on physical activity, heart rate, and sleep patterns. Variations in output reflect the use of different Fitbit trackers and individual tracking preferences.
Data Organization
With 18 CSV documents representing distinct quantitative Fitbit data, each user is uniquely identified, and data is organized by day and time. The longitudinal structure allows for a comprehensive analysis.
Data Integrity and Credibility
While the dataset provides valuable insights, limitations include a small sample size and a lack of demographic information such as gender, age, location, lifestyle, potentially introducing sampling bias. The dataset’s age and the survey’s two-month duration further influence the analysis, prompting an operational approach.
Third Phase: PROCESS Phase
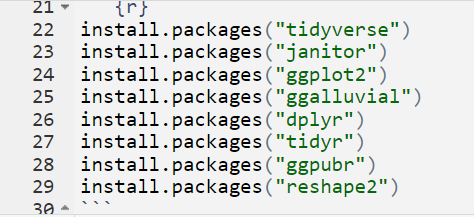
Setting Up My Environment
R Studio was chosen for its robust capabilities in handling large datasets, and providing the necessary tools for preparation, processing, and analysis. Here is the link to the full codes on Kaggle.
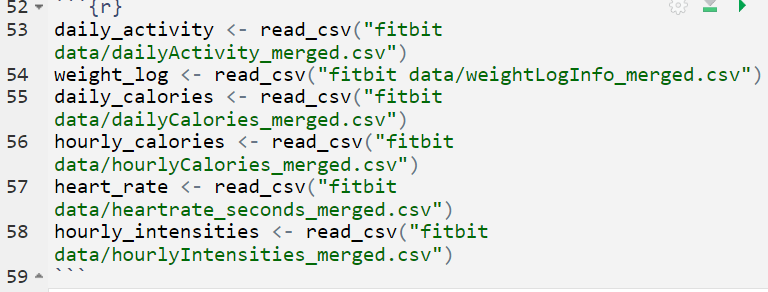
Importing Datasets
For this analysis, the datasets for daily activity, daily calories, hourly intensities, hourly calories, heart rate and weight log datasets were used.
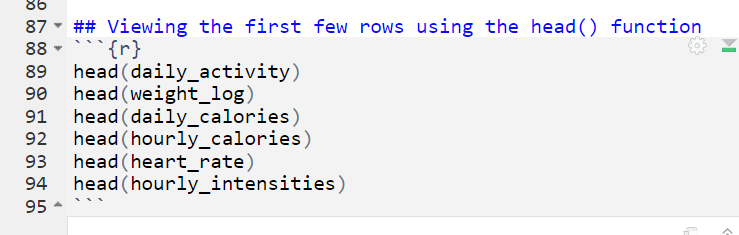
Previewing Datasets
Before delving into analysis, a preliminary exploration of datasets was undertaken, ensuring a clear understanding of the available information.
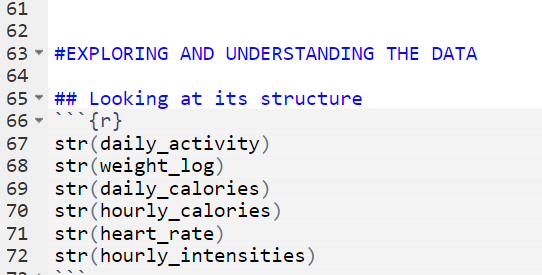
3.4 Checking Data Structure
The structure of the data was assessed to ascertain its compatibility with the intended analyses and to address any potential challenges in processing.
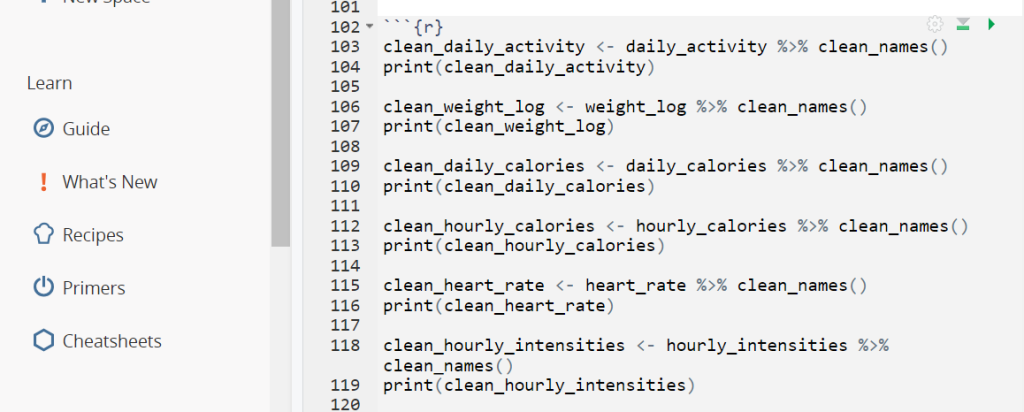
Cleaning and Formatting
Data cleaning procedures were implemented to ensure consistency, accuracy, and readiness for subsequent analytical steps. They include: standardizing columns, checking for missing values and duplicates,
Fourth and Fifth Phase: ANALYZE and SHARE
Summary Statistics
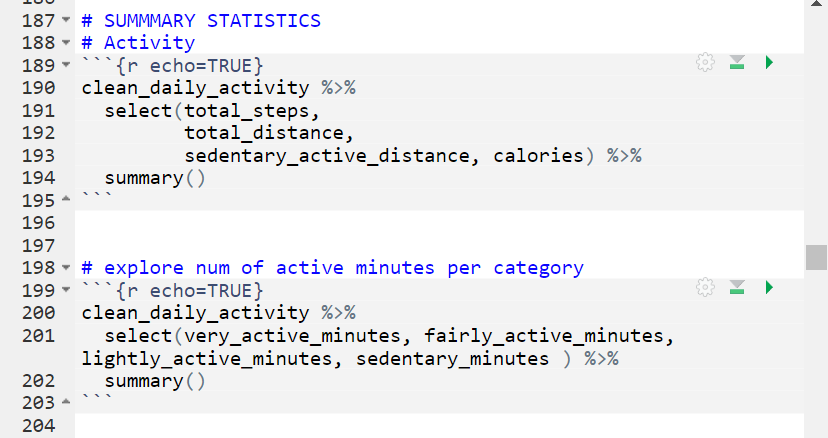
Total Steps and Distance:
- The users’ daily step count varies significantly, ranging from 0 to a maximum of 36,019 steps.
- On average, users take around 7,638 steps per day, with a median of 7,406 steps.
- The total distance covered on average is 5.49 kilometers, with a median distance of 5.25 kilometers.
Sedentary Behavior:
- Users exhibit minimal sedentary active distance, with the majority showing no distance covered during sedentary activities.
- The mean sedentary active distance is extremely low at 0.0016, suggesting limited movement during sedentary periods.
Caloric Expenditure:
- The average daily caloric expenditure is 2,304 calories, with a median of 2,134 calories.
- Caloric values range from a minimum of 0 to a maximum of 4,900 calories per day.
Active Minutes:
- Very active minutes vary widely, with users spending between 0 and 210 minutes in highly active pursuits.
- Fairly active minutes have a mean of 13.56 minutes, ranging from 0 to 143 minutes.
Distribution of Light and Sedentary Activity:
- Lightly active minutes have a mean of 192.8 minutes, with a median of 199 minutes.
- Sedentary minutes, on the other hand, show a mean of 991.2 minutes, indicating a considerable portion of the day spent in sedentary activities.
Key Takeaways
- Diverse Activity Levels:
- Users showcase diverse activity levels, from sedentary to highly active, suggesting a broad user base with varied fitness routines.
- Sedentary Habits:
- The prominence of sedentary minutes highlights an opportunity for Bellabeat to introduce features or prompts encouraging users to incorporate more movement throughout the day.
- Caloric Insight:
- Understanding users’ caloric expenditure provides a foundation for personalized nutrition recommendations within the Bellabeat Membership, optimizing user engagement.
- Active Minute Goals:
- The wide range of active minutes opens avenues for tailored fitness goals within the Bellabeat app, promoting a dynamic and customizable user experience.
Activity Levels for the Various User IDs
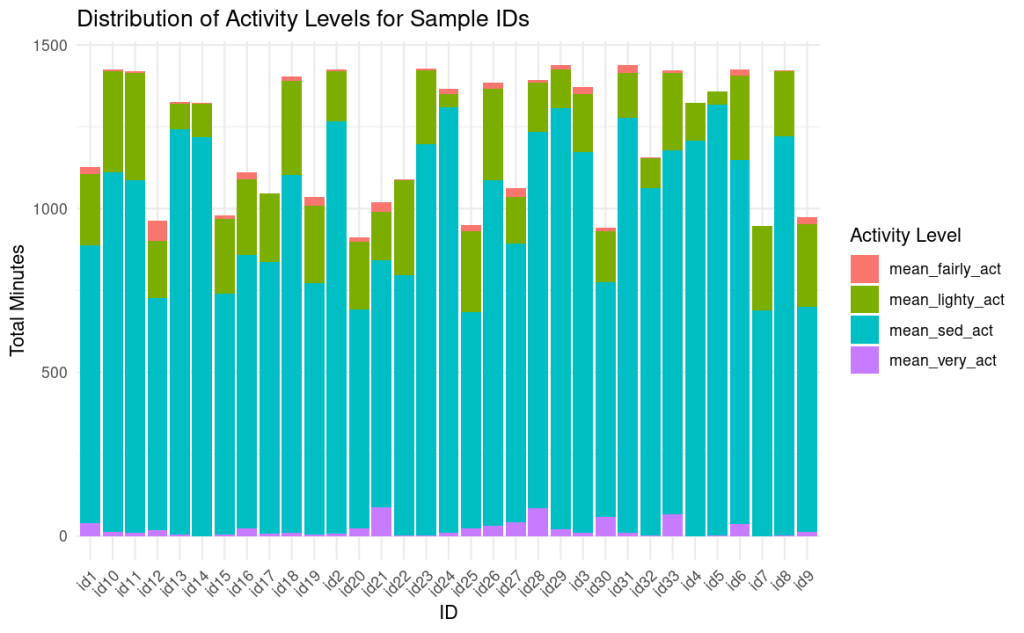
The stacked bar plots revealed a clear winner: sitting around (sedentary activity), which takes up the most time for users. It’s way ahead of other activity levels. The second-biggest chunk of time goes to light activities—things that move you but aren’t super intense. On the flip side, the time spent in highly active stuff, like vigorous workouts, is less.
What does this mean for Bellabeat? First off, seeing a lot of sitting time suggests we need more ideas to get folks moving during the day. And since many users are into lighter activities, Bellabeat can give tips to make those activities even more beneficial. Lastly, knowing how people split their activity time helps Bellabeat set realistic goals in their app, making it easier for users to stay active in a way that fits their routines.
Relationship between Average Distance and Average Calories Burnt
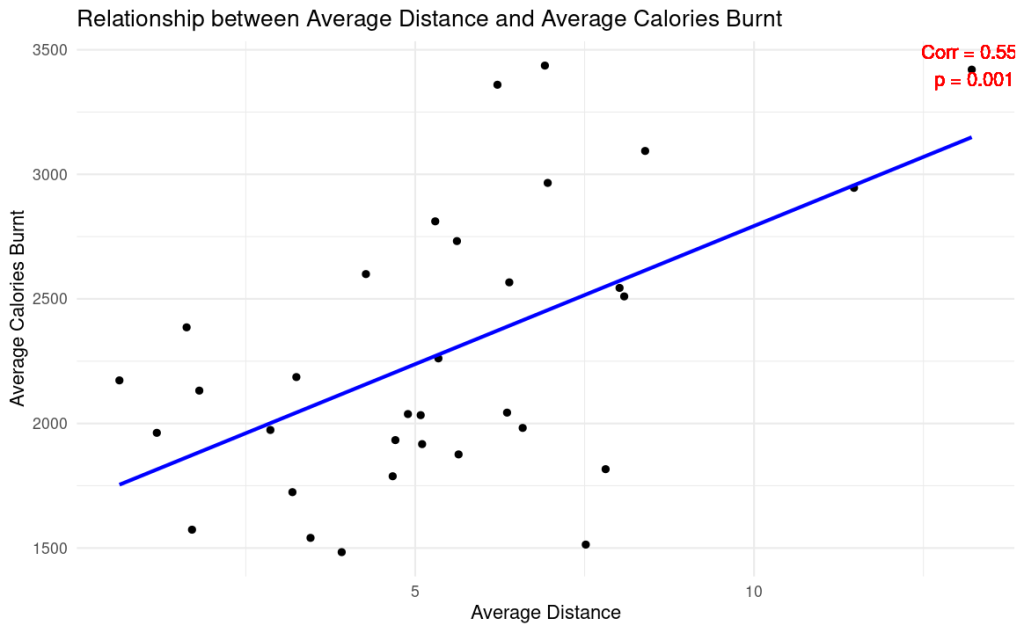
A fascinating connection has emerged between the average distance covered and the calories burnt. The data reveals a moderate positive linear relationship, signified by a correlation coefficient of 0.55. In simpler terms, as the average distance increases, there is a notable tendency for the average calories burnt to rise as well.
Delving into the statistical significance of this relationship, the p-value of 0.001 indicates that the observed correlation is not a random occurrence. At a common significance level (like 0.05), the p-value tells us we have strong evidence to reject the null hypothesis. In layman’s terms, there’s a solid foundation to believe that there is indeed a meaningful correlation between average distance and calories burnt.
Relationship Between Very Active Minutes and Calories Burnt
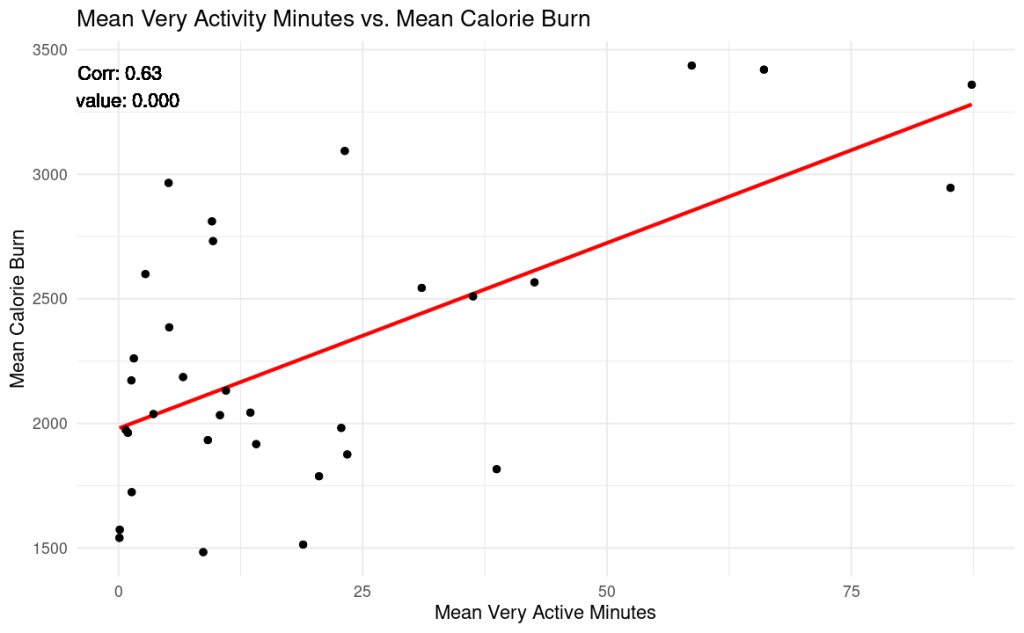
I uncovered a meaningful connection between Very Active Minutes and Calories Burnt, as reflected in a correlation coefficient (corr) of 0.63. This value signals a moderate positive linear relationship—meaning, as Very Active Minutes go up, so do the Calories Burnt. This correlation brings valuable insights into how users’ highly active moments align with their calorie expenditure.
What makes this finding even more noteworthy is the p-value of 0.000, practically zero. This ultra-low p-value indicates that the observed correlation is not just a random occurrence; it’s statistically significant. In simpler terms, the likelihood of this correlation happening by chance is extremely low.
Relationship Between Sedentary Minutes and Calories Burnt
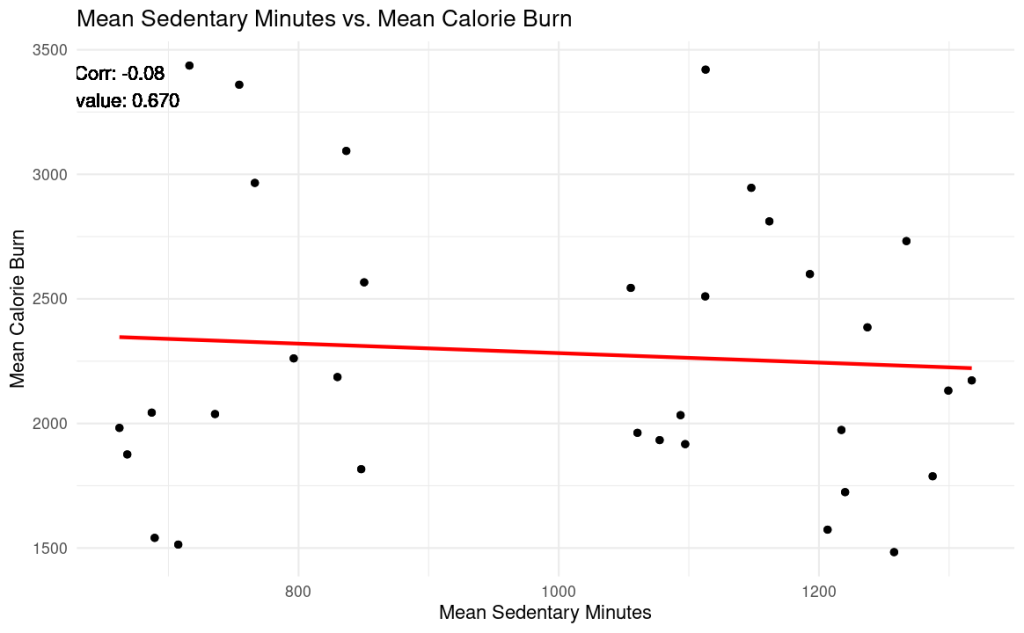
a correlation coefficient of -0.08 coupled with a high p-value of 0.67 indicates a feeble and statistically inconsequential negative link between sedentary minutes and calories burnt. To put it simply, the data suggests that changes in sedentary minutes aren’t likely to consistently coincide with changes in calories burnt.
This finding holds valuable insights for our understanding of the relationship between sedentary behaviour and calorie expenditure. It suggests that factors beyond merely sitting influence how many calories we burn, emphasizing the multifaceted nature of our metabolism and activity levels. As we delve deeper into these nuances, it becomes clear that a holistic approach to health, considering various lifestyle factors, is crucial in crafting meaningful wellness recommendations for Bellabeat users.
Relationship Between Average Total Intensity and Time
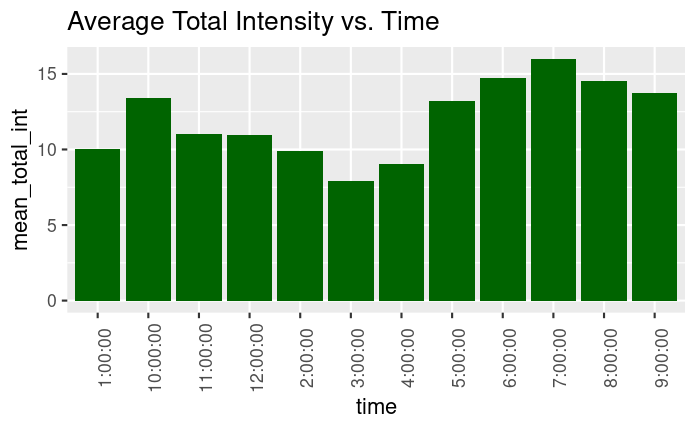
Examining the plot detailing average total intensity over time reveals insightful patterns in user activity. The bar graph distinctly highlights two prominent peaks: one between 5 – 8 pm and another around 10 am. Simply put, these are the times when users generally exhibit the highest activity intensities throughout the day.
This discovery holds significance for Bellabeat’s understanding of user behaviour. The evening surge suggests that a substantial portion of users engage in intense activities during the post-work hours, potentially incorporating workouts or other physically demanding pursuits. The morning peak around 10 am aligns with a burst of activity, indicating that users are active early in the day. Recognizing these peak periods enables Bellabeat to strategically time notifications, recommendations, or features within its app, enhancing user engagement and promoting a more active lifestyle.
Sixth Phase: ACT
In conclusion, the data-driven exploration of Bellabeat’s smart device fitness data has unveiled key insights pivotal for shaping the future of the Bellabeat Membership and refining the overall marketing strategy. Understanding user behaviors, we observe a prevalent trend of sedentary activity with notable peaks in light and intense activities during specific hours. Additionally, the lack of a consistent relationship between sedentary minutes and calories burnt suggests the need for a thoughtful approach to health recommendations.
High-Level Recommendations:
- Tailored Engagement Peaks:
- Capitalize on the observed peaks in activity around 10 am and between 5 – 8 pm. Strategically time app notifications, challenges, or exclusive content during these periods to maximize user engagement.
- Holistic Wellness Integration:
- Extend the Bellabeat Membership’s focus beyond physical activity. Integrate features catering to mental well-being and holistic lifestyle choices, aligning with the broader trends in wellness.
- Gamification for Sustained Engagement:
- Introduce gamification elements to sustain user motivation. Challenges, badges, and rewards can foster a sense of community, turning fitness into an engaging and rewarding experience.
- Communication Optimization:
- Optimize communication channels based on user preferences. A multi-channel approach, including social media, emails, and in-app notifications, ensures consistent and effective communication.
- Refined Health Recommendations:
- Leverage insights into sedentary behaviors and activity patterns to provide well-thought-out health recommendations. Encourage short breaks during sedentary periods and tailor fitness goals based on observed user routines.
By implementing these high-level recommendations, Bellabeat can position the Membership program as a dynamic and personalized wellness solution, resonating with users and further solidifying its position in the competitive smart device market. These strategies not only leverage the current data insights but also anticipate evolving user needs, ensuring Bellabeat remains at the forefront of health-focused innovation.