In a world where not everyone has enough food to eat, figuring out how to solve this problem is super important.
The world is facing a looming food crisis. The global population is projected to reach 9.7 billion by 2050, and food production will need to increase by 70% to meet the demand. However, climate change, water scarcity, and other factors are putting a strain on food production systems.
Data analytics can play a critical role in addressing the world’s food shortage problem. By analyzing large datasets on food production, food supply, global hunger index, and world population, we can identify trends, patterns, and potential solutions.
Getting to Know the Datasets
We’re diving into data from African countries between 2004 and 2013 to understand how much food they produce and have available. I’ve also brought in data about how hungry people are globally to see how it connects. And population data from the World Bank to look at the relationship between population numbers over the years and these food indices.
Here are some details of each dataset:
1. Food Production data (2004 – 2013)
This data from the Food and Agriculture Organization of the United Nations (FAO) gives us a good look at what kind and how much food African countries made in the past ten years. The “Item” states the specific food we’re talking about, while “Value” states how much of that food was produced by the respective countries each year measured in Kiloton (kt).
2. Food Supply (2004 – 2013)
The values in the food supply dataset, measured in kcal/person/day, provided by the FAO represent the quantity of food available for human consumption in a country in a given year.
3. Global Hunger Index (GHI) Data
From the International Food Policy Research Institute, this dataset gives us a big picture of hunger worldwide. It looks at things like not enough food, kids not growing well, underweight children, and child deaths.
The GHI scores for each year, looking at how hunger changed; the lower the score, the less severe the Hunger Index and vice versa.
4. Population Data
This dataset from the World Bank, adds another layer by showing us how many people live in each country. This lets us explore how population growth and food production/supply are connected.
Data Preprocessing
After importing the data sets, I prepared them by checking for duplicate and null values and converting the data types to ones that would enable me to work with the data.
As I dug into these datasets, I tried to figure out how food, hunger, and population fit together – what patterns can I unravel to help us solve the world food shortage problem? Come along as I uncover the stories hidden in the numbers and imagine a future where everyone has enough to eat.
Average Food Production and Supply
Diving into the statistics of food numbers, I stumbled upon a curious finding: the average food supply (2469.78) surpasses its production (327.79) tons of measure. Think of it as having a plate full of food and realizing there’s even more in the kitchen. But why? The food supply metric, a reflection of what’s available for us to eat, considers not only what a country produces but also what it imports. These averages spark curiosity, urging us to unravel the mysteries behind the production and distribution of food.
Food Supply Distribution
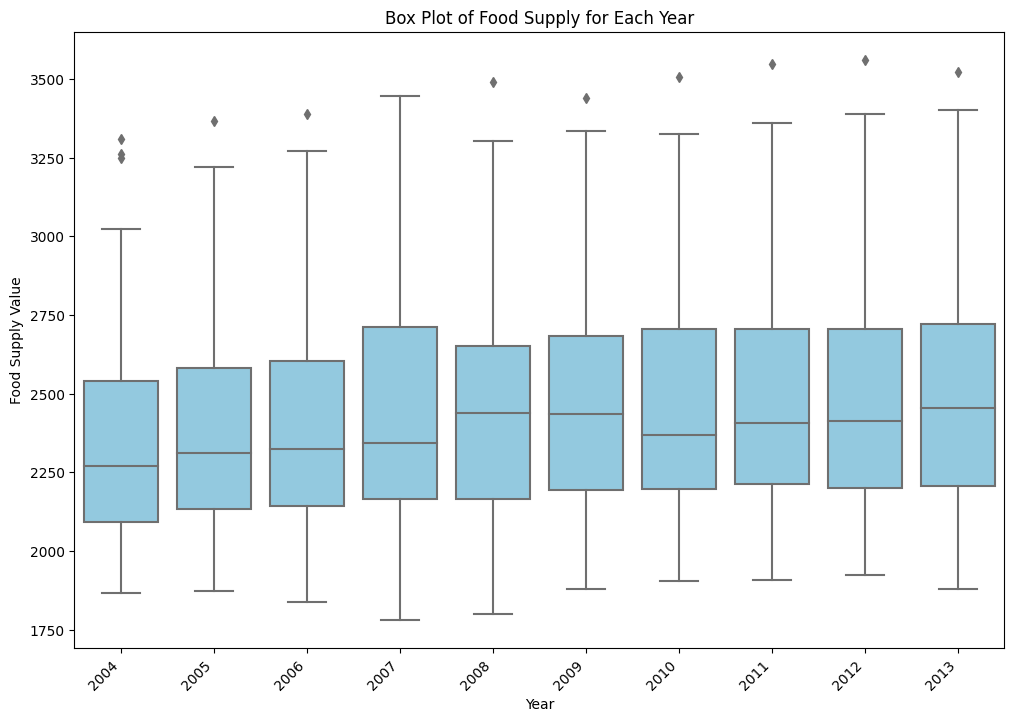
The Box Plot for food supply shows some outliers. The outlier was mainly Egypt which had high supply values over the years 2004 – 2013 (except 2007), as well as Morocco and Tunisia in 2004.
Correlation Between Food Production and Food Supply
The correlation coefficient of approximately 0.28 between food production and food supply unveils a nuanced connection in the world of food. It implies that, on average, when a country increases its food production, there’s a modest yet discernible 28% tendency for the food supply to also rise.
However, it’s crucial to note that this correlation is not absolute, signifying that other factors, such as trade and import/export dynamics, also play a significant role.
Understanding this dance between production and supply could guide policymakers and organizations in making informed decisions about food security and distribution, emphasizing the need for comprehensive strategies that consider both local production capabilities and global trade networks.
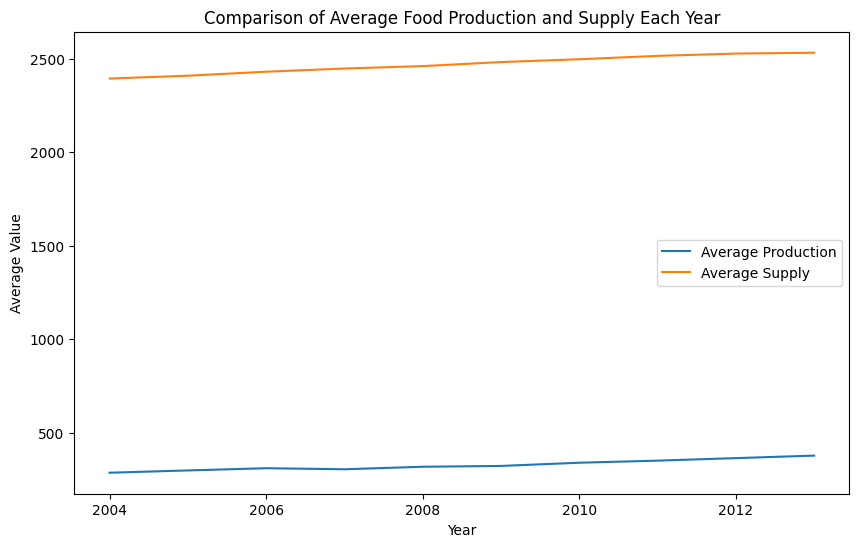
Time Series Plots for both Food Production and Food Supply
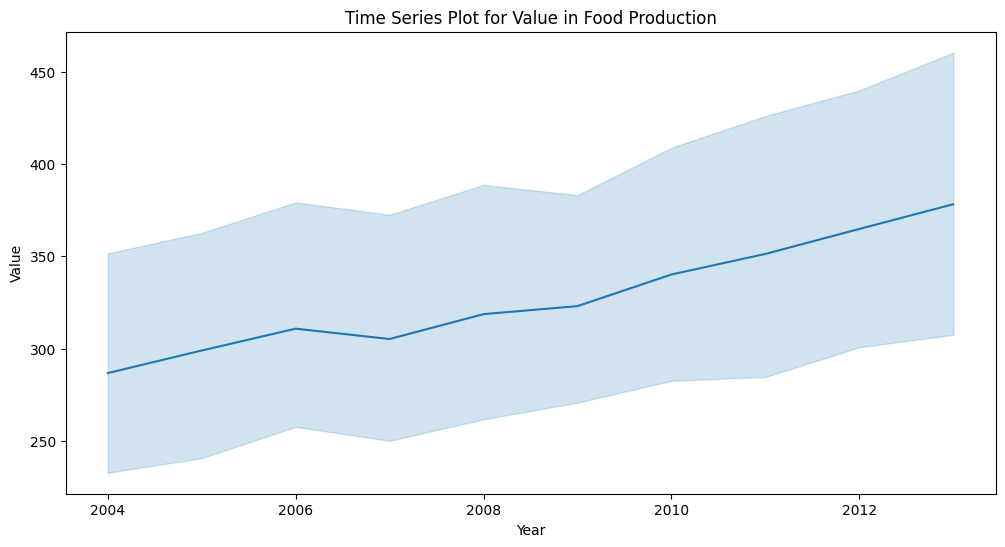
Over the ten years from 2004 to 2013, there has been a consistent upward trend in both the global production and supply of food. This positive trajectory suggests an overall improvement in the world’s capacity to produce and make food available for consumption.
However, while the visualizations show progress, it’s essential to investigate the driving forces behind this increase. Factors such as technological advancements, agricultural policies, and international collaborations may have contributed to this positive trend, forming a foundation for further exploration and analysis.
Country’s Performance
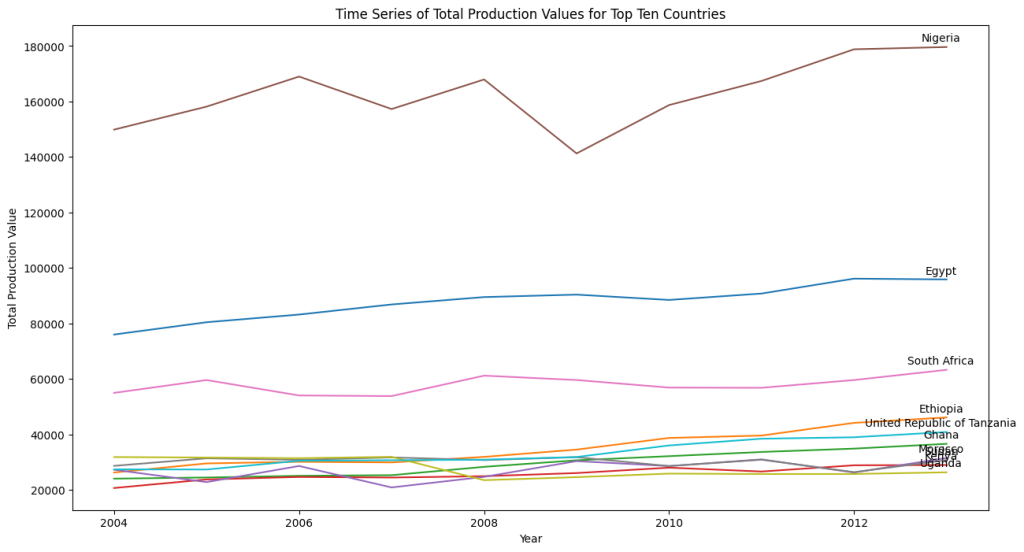
The Line Plot depicting total production values over time for the top ten food production countries in Africa offers a view of the global food production landscape. Across these top ten countries, including Nigeria, Egypt, South Africa, and others, there is a general upward trend in production values.
This suggests an overall positive trajectory in their ability to contribute significantly to the global food supply. However, amidst this growth, I noticed a notable dip in Nigeria’s production values in 2009. This dip may stem from various factors, such as economic challenges, climatic conditions, or specific policy issues.
Food Items Commonly Produced by the Top 10 Food Production Companies
Exploring the common food items among the top 10 countries in food production reveals a rich tapestry of agricultural contributions. These countries, including Nigeria, Egypt, South Africa, and others, exhibit a diverse range of staple and non-staple foods in their production portfolios.
From key staples like Rice, Maize, and Sorghum to protein sources like Poultry Meat and Bovine Meat, the list underscores the multifaceted nature of their agricultural activities. Additionally, the inclusion of products like Beer and Freshwater Fish highlights the cultural and economic significance of diverse food items.
Understanding the commonalities among these countries sheds light on the shared emphasis on certain crops and livestock, forming the backbone of their food production systems.
Time Series of Total Supply Values for the Top 10 Countries
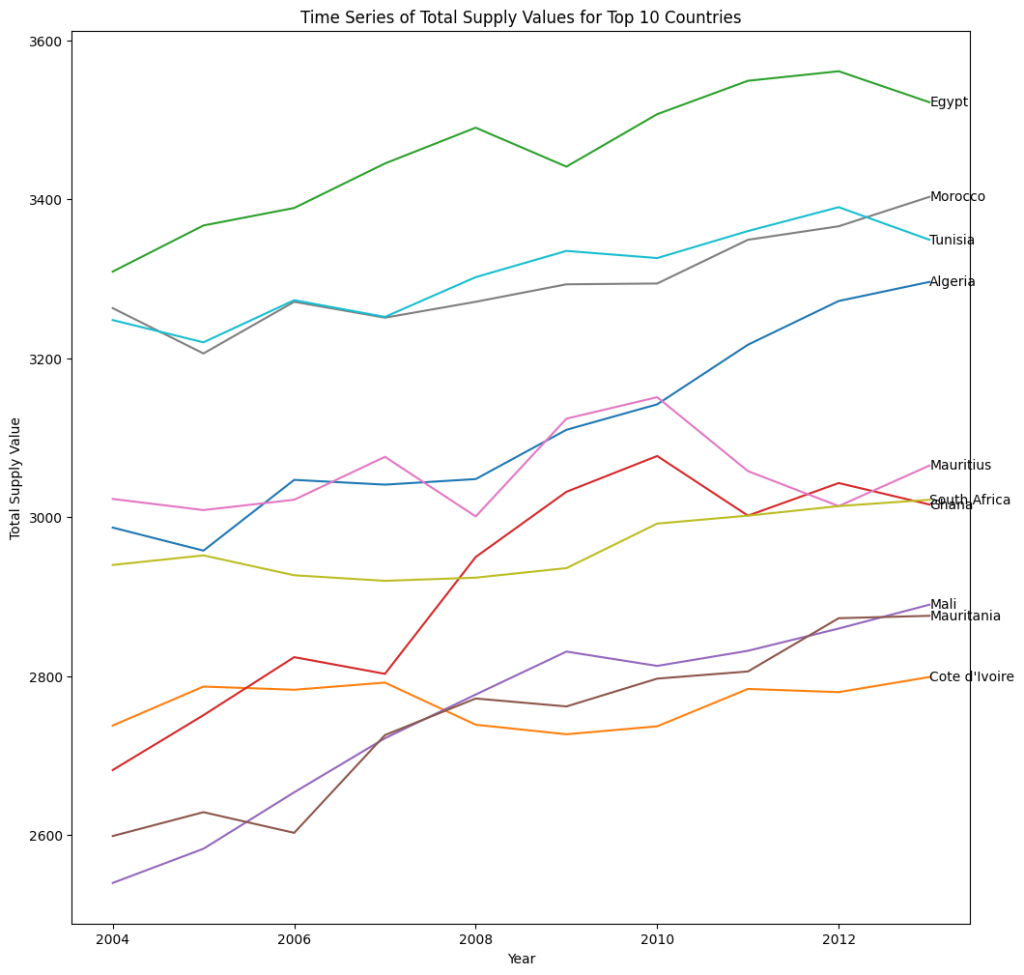
Across these nations, we observe a consistent trend of increasing food supply, indicating efforts to meet growing demands. However, while most exhibited a steady rise, Mauritius deviated with a decrease in 2009, followed by a subsequent increase in 2012. This fluctuation in Mauritius could be attributed to various factors such as climate conditions, economic shifts, or policy changes.
Dominant Food Items in Production
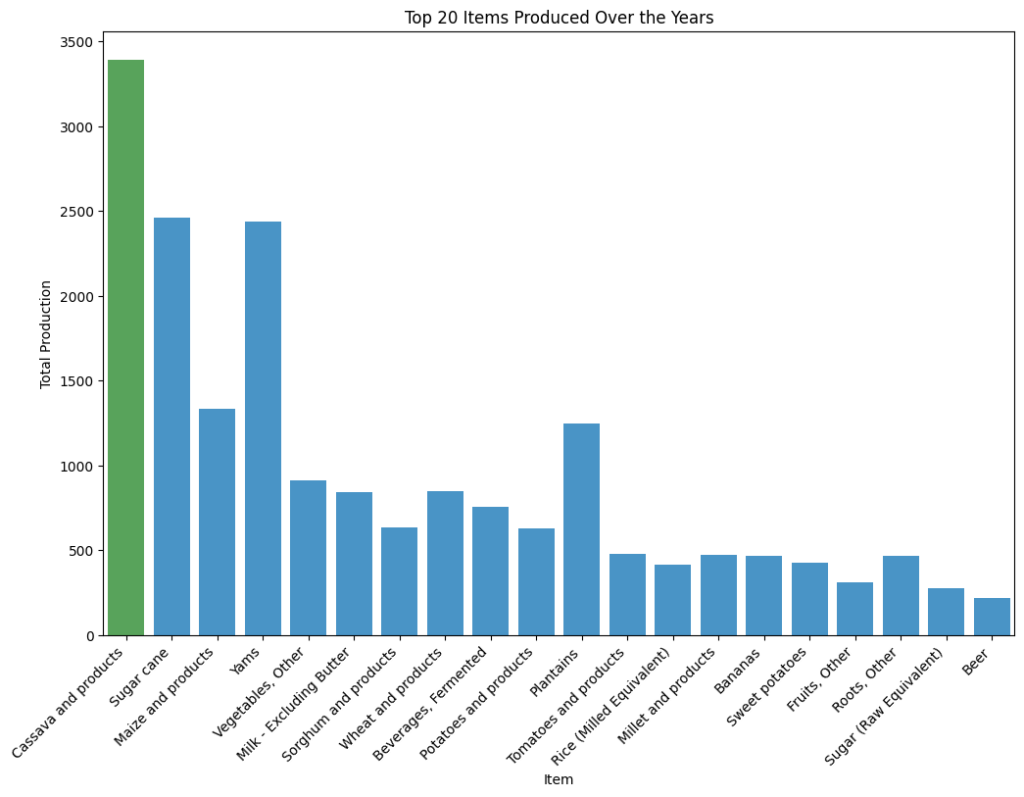
Analyzing the highest-produced food items unveils a diverse landscape in African countries’ agricultural outputs. Cassava and its derivatives emerge as the leading contributors to food production, underscoring its significance in regional agriculture. Sugar cane, maize and maize products, yams, vegetables, milk, and sorghum follow suit, forming a tapestry of staple crops and essential food sources.
This diversity in production aligns with the varied dietary preferences and agricultural practices across the continent. The prominence of these items signifies their crucial role in addressing food security and sustaining local economies, shaping the foundation of African nations’ food production landscape.
Leading Producers of Essential Food Items
Highlighting the leading producers of the top 20 food items over the past decade emphasizes the pivotal role played by several African nations in sustaining the region’s food security. Nigeria, South Africa, Egypt, Sudan, Uganda, Ethiopia, and Rwanda emerge as the frontrunners, consistently contributing to the production of these essential food commodities.
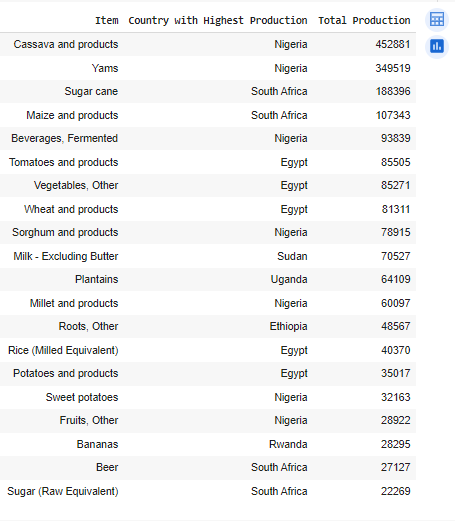
Among them, Nigeria stands out as the most frequent producer, underscoring its central role in cultivating a diverse range of crucial food items. This concentration of production in specific countries signifies the collaborative effort required to address regional food challenges, presenting opportunities for knowledge sharing and coordinated strategies to enhance overall food production.
Steady Growth and a Surprising Gap in Food Production and Supply
The analysis of average values over the ten years reveals a positive trajectory in both food production and supply across African countries.
This consistent upward trend reflects the collective efforts and resilience in enhancing agricultural practices and ensuring a steady flow of food resources. However, a notable revelation is the substantial difference between production and supply values, with the latter consistently surpassing the former by a factor of five.
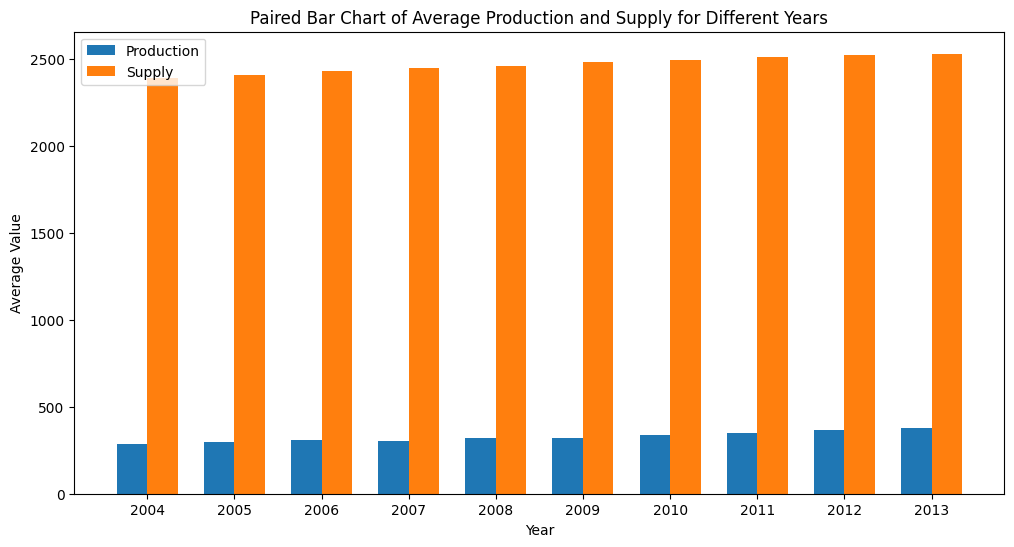
This substantial surplus in food supply signifies the intricate dynamics of global trade and import-export relationships, where countries rely on international transactions to meet the demands of their populations.
While increased food supply shows a proactive approach to ensure ample availability for consumption, understanding the factors contributing to this surplus could uncover opportunities for more sustainable and fair food distribution systems.
Rice Harvest Flourishes Alongside Growing Populations
Rice is a commonly grown and consumed crop in most countries. I explored population and rice production values to see if the size of a population relates to how much rice a country grows.
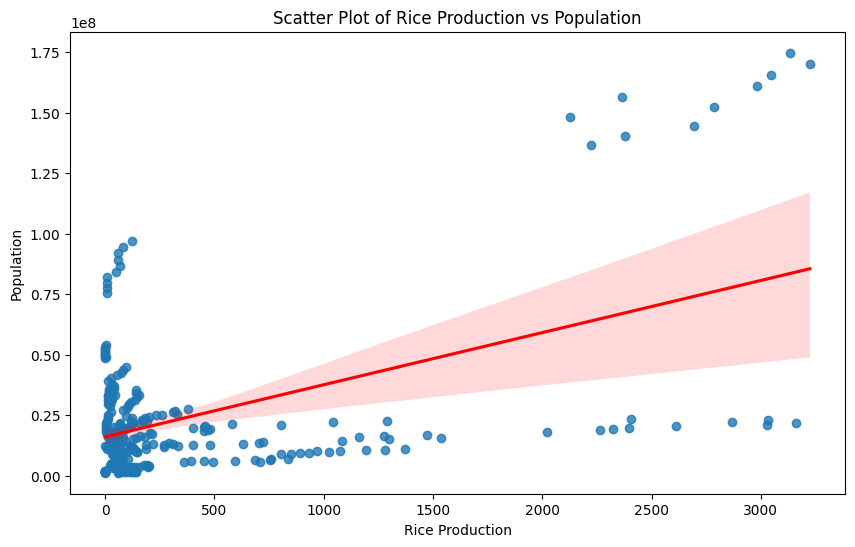
The null hypothesis made was: There is no significant relationship between rice production and population.
The null hypothesis which set the backdrop for my exploration postulates a scenario where rice production and population were independent entities. The p-value, a powerful indicator, stood at 3.27e-20, providing compelling evidence against the idea that rice production and population are unrelated.
Picture a garden and the number of people enjoying its harvest. It turns out, that as the community grows, so does the abundance of rice. It’s not just a random connection.
The findings tell a clear story: when more people live in certain African countries, more rice is also produced.
Hence, I rejected the null hypothesis.
Connecting the Dots between Population and Food Supply
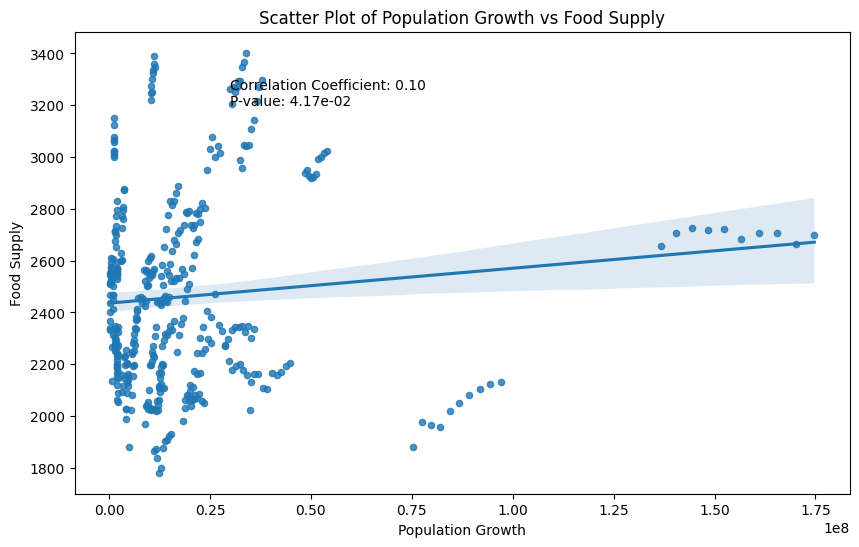
The scatter plot unveiled a subtle correlation, with a coefficient of 0.10. While this might not seem overwhelmingly strong, the associated p-value of 4.17e-02 indicates that the relationship is statistically significant. In simpler terms, as populations grow in certain African countries, there’s a meaningful uptick in the availability of food.
Unravelling the Threads Between Food Production and Hunger
Diving into the correlation between food production and the Global Hunger Index (GHI), our scatter plot revealed a noteworthy coefficient of -0.10.
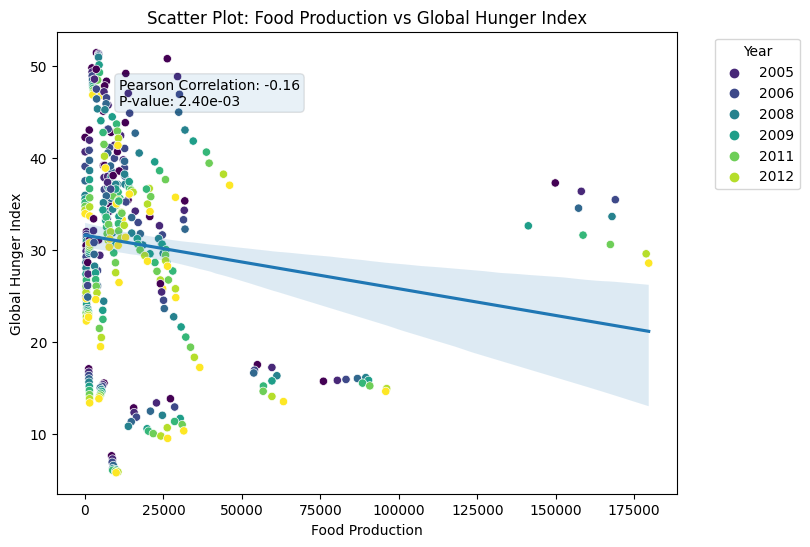
This negative correlation implies that as food production increases, the GHI tends to decrease, indicating lower hunger levels. The associated p-value of 2.40e-03 adds weight to this correlation, suggesting its statistical significance. In simpler terms, when food production flourishes in certain African countries, there’s a statistical tendency for hunger levels to decrease. This discovery opens up avenues for further exploration of how boosting food production can potentially alleviate hunger challenges.
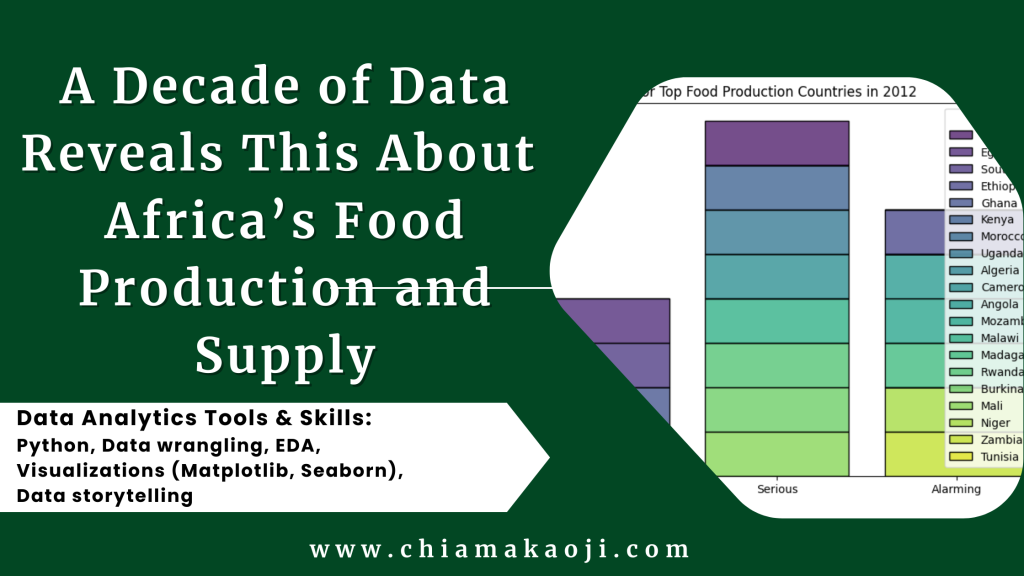
Unveiling the Shadows of Hunger Severity
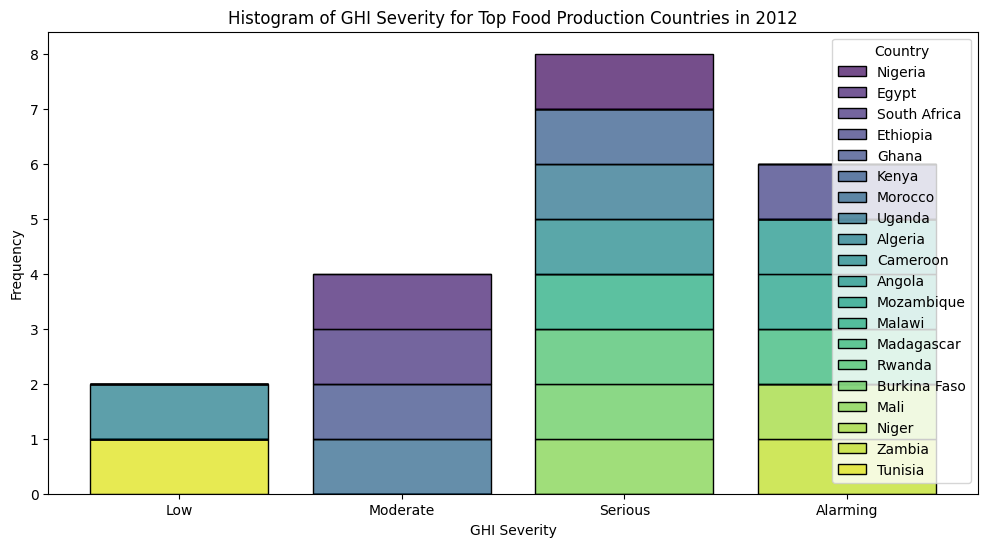
Despite being among the top food-producing countries in Africa, many nations find themselves ensnared in varying degrees of hunger severity. The majority fall within the categories of Serious, Alarming, Moderate, and Low on the Global Hunger Index (GHI).
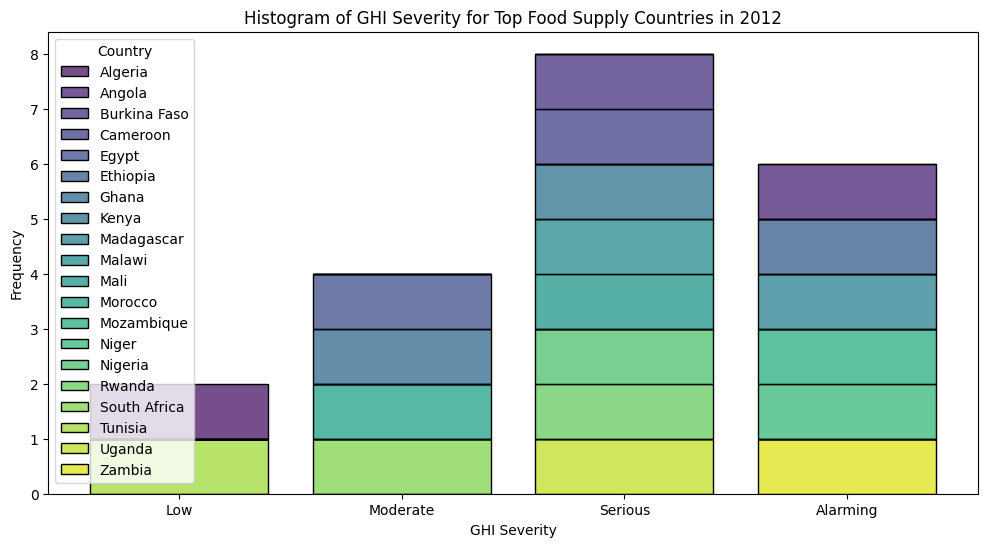
This unexpected correlation highlights a complex scenario, suggesting that high food production and supply alone do not guarantee low hunger levels. It beckons us to delve deeper into the nuanced factors influencing the hunger landscape, paving the way for more targeted interventions in the fight against hunger and world food shortage problems.
Unravelling Africa’s Food Odyssey
Our exploration into African food landscapes, from 2004 to 2013, tells a story of growth and challenges. Over the decade, food production and supply steadily climbed, showcasing progress.
Surprisingly, supply consistently outpaced production, leaving us to ponder the ‘why,’ and how we can reduce this gap. Our investigation revealed a vital link – as populations grew, so did rice production, offering a glimmer of hope. Yet, an unexpected twist emerged: high food production didn’t guarantee low hunger levels. Even top producers faced severe hunger challenges.
This paradox beckons leaders and policymakers to dig deeper, addressing the underlying issues for a hunger-free Africa.
Recommendations for Addressing Africa’s Food Shortage and Hunger
1. Embrace Sustainable Agriculture Practices
The data illustrates a consistent growth in food production and supply over the years. To sustain this progress, there is a pressing need to advocate for and implement sustainable agriculture practices. This includes promoting organic farming, efficient water usage, and eco-friendly cultivation methods.
2. Fostering Equitable Food Access through Enhanced Distribution Systems and Inclusive Policies
Despite high food production, challenges persist in translating abundance into improved nutrition for all. The Global Hunger Index (GHI) highlights disparities in food accessibility, signalling the need for targeted interventions in distribution channels and inclusive policy frameworks. To address this, recommended strategies include refining distribution systems, implementing community-based programs, and fostering policies that consider socio-economic factors. By focusing on these initiatives, we aim to bridge the gap between food abundance and its equitable availability, contributing to a more nourished global population.
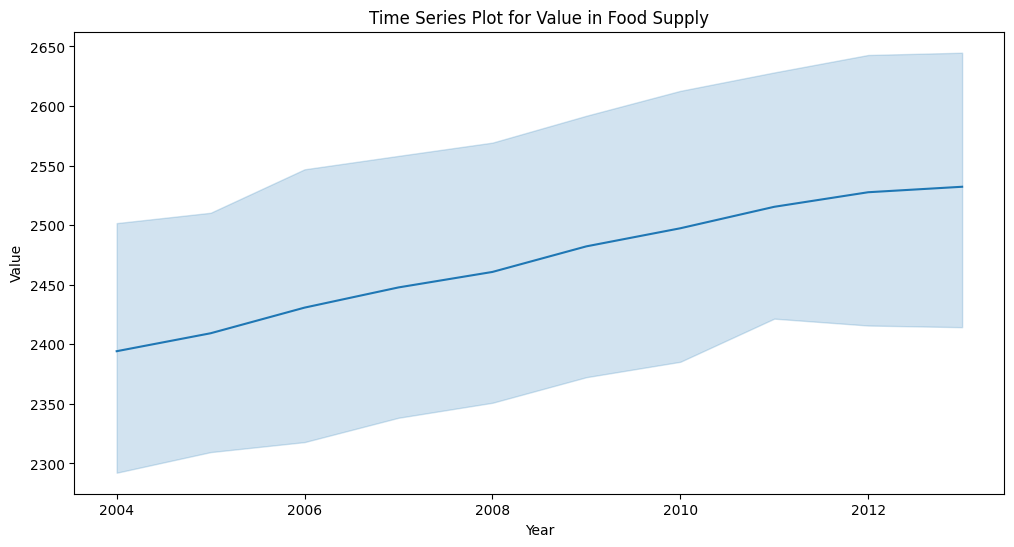
3. Invest in Infrastructure for Agricultural Development
The Time Series Plot for Value in Food Supply highlights a continuous increase, emphasizing the crucial role of efficient infrastructure.
The FAO calculates food supply using a food balance sheet approach. This approach involves estimating the total production of food in a country, subtracting the amount of food that is exported or used for non-food purposes, and adding the amount of food that is imported. The resulting figure is the food supply that is available for human consumption.
The supply of food may include imports from other countries. If a country relies heavily on importing food, it may contribute to a higher supply compared to what is produced domestically.
Investments in agricultural infrastructure, such as irrigation systems, storage facilities, and transportation networks, are vital for reducing post-harvest losses and improving distribution efficiency while decreasing imports from other countries and increasing exports.